We got a lot of data. A LOT. In this article, we wonder a bit into the large dataset.
There is a map, with the approximate position of X-Cubesat when he emitted the housekeeping received.
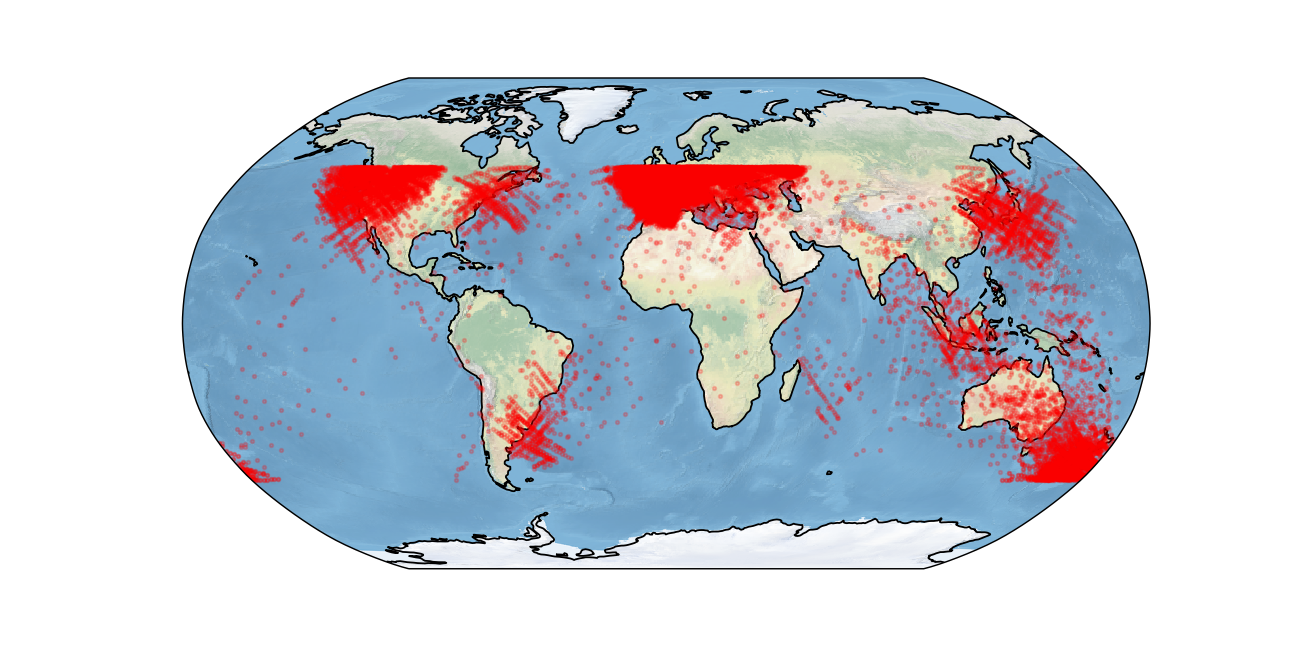
In Red, X-CubeSat's localization when he emitted the telemetry. Obtained from TLE and epoch of emission. Click on the image to enlarge.
Temperature of the batteries
We measured the temperature of the satellites from our ground station. The most interesting one is the battery temperature.
The Ground station had some issues, hence the missing points.
We can see a surprising variation of a few dozen of date. This can accually be simply answered by looking at the time of the observation.
See by yourself.
Because of the natural precession of the orbital plan (due to the J2 term of Earth’s gravity), there was an slow evolution of the hour in the day of the temperature measurement.
The precession rate \(\omega_p\) is
\( \omega_{p} = -\frac32 \cdot \frac{{R_\mathrm{E}}^2}{\left(a\left(1-e^2\right)\right)^2} J_2 \omega \cos i \)
with \(R_\mathrm{E}\) Earth equatiorial radius, \(a\) the semi-major axis of the satellite’s orbit, \(e\) is the eccentricity, \(\omega\) is the angular velocity of the satellite and \(i\) is it’s inclination.
About
The figures are generated with Bokeh, using JavaScript for the interactivity. You need the allow the third party sources to see them.
To add a figure in a similar static page, see this guid.